An Introduction to the Composite Financial Index
We recently launched the next generation of Jenzabar Analytics, a portfolio of descriptive, diagnostic, and predictive analytics tools. Institutions are now be able to gather, organize, assess, and transform data into actionable insights. The first module available is the Financial Analytics Model.
This model helps institutions use data to manage resources to maximize success using the key performance indicators and ratios you need to support your mission, including:
- Operating results
- Resource sufficiency and flexibility
- Asset performance and management
- Liquidity
- Debt management
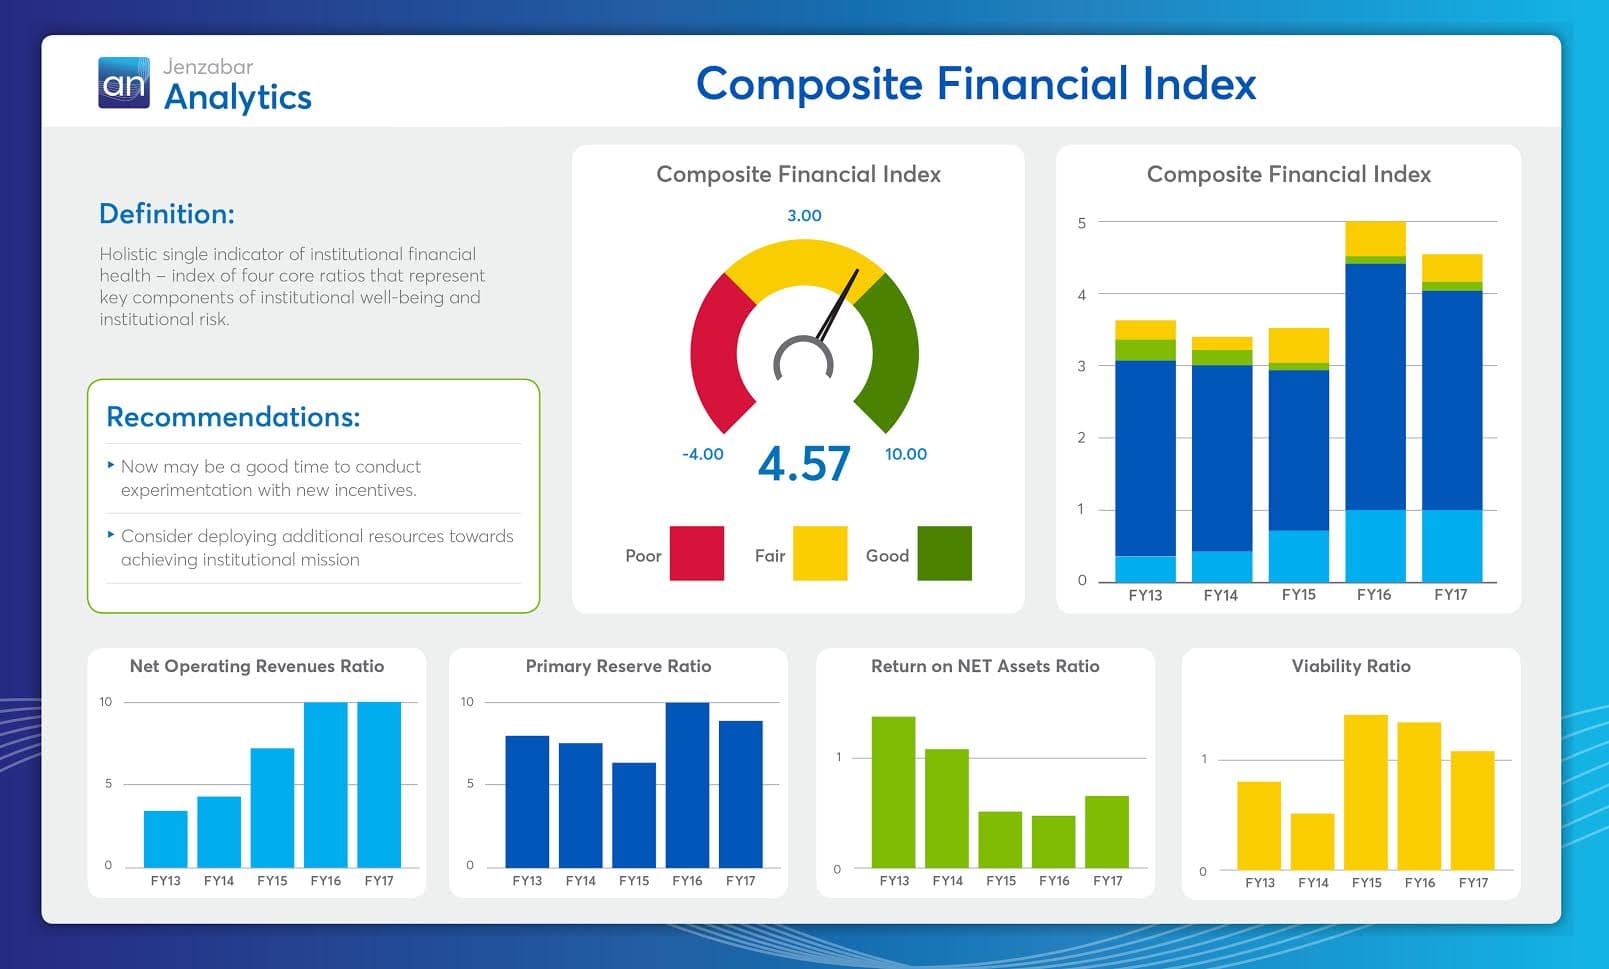
What is the Composite Financial Index?
Jenzabar’s Financial Analytics Model also tracks your Composite Financial Index (CFI) score giving you a quick look at the overall financial health at a single point in time. It will help you answer the question “Is it time to invest in new initiatives to support your mission or should you retrench to improve your institution’s financial health?”
The CFI includes four commonly used financial ratios:
Primary Reserve Ratio is a measure of the level of financial flexibility. To calculate the primary reserve ratio, use the total resources that an institution could spend on operations minus property, plant and equipment net, plus long term debt divided by the total expenses for the year. This ratio serves as a direct measure of an institution’s viability and an indirect measure of its liquidity. It is one factor to determine if you have enough flexible resources to support your mission.
"A ratio of .40x (provides about 5 months of expenses) or more is recommended to have the financial flexibility needed to manage the institution."
Net Operating Revenues Ratio is a measure of the operating performance. It indicates whether the institution is operating within its available resources - making money or losing money in its basic day-to-day business of educating students. To calculate this ratio, divide the change in unrestricted assets from the beginning to the end of the year by the total unrestricted revenues,
"A target of at least 2%-4% is a goal over an extended period."
Return on Net Assets Ratio measures total economic return and is useful for analyzing year over year trends. To calculate this ratio, divide the change in total net assets from the beginning to end of the year by the total net assets at the beginning of the year. As a note, it may be advisable for some institutions to calculate this on a three-year rolling average, as individual years can see steep variations depending upon long term investment returns.
"The goal is a 3% – 4% return over the long-term."
Viability Ratio measures the ability of available assets to cover debt such as capital leases, notes payable, and bonds payable). It indicates the institution’s ability to take on new debt. To calculate the viability ratio, divide expendable resources by long-term debt.
"A ratio between 1.25X and 2.00X indicates there are sufficient resources to cover current obligations."
It is important to understand that some institutions, particularly public ones, may be operating well even with a ratio under the recommended targets. Each institution should carefully consider how much debt is affordable in its context.
Once each of the four ratios is calculated, the relative strength of the score, or strength factor, and its importance in the mix of creating a composite score, or weight, are computed. The result is a weighted score for each indicator that when added together produces the Composite Financial Index. The strength factors and CFI score are standardized scores that fall along a scale of -1 to 10.
A CFI score of less than three indicates a need for serious attention to the institution’s financial condition. A score of greater than three indicates an opportunity for strategic investment of institutional resources to optimize the achievement of institutional mission.
Measuring financial health is more important than ever in today’s dynamic higher education market. Making decisions based on real data helps to improve operational performance by identifying patterns and opportunities to cut costs and streamline operations. Decisions based on facts and data dramatically increases the speed of decision-making enabling institutions to be nimbler and adjust to market changes.